|
|
|
|
|
Dashboard InfoObjects
Valuemation enables you to use interactive reporting and visualization of important KPIs and analyses in the form of various dashboards. The dashboards are available as authorized InfoObjects used mainly on the welcome pages (Home Perspective) of various Valuemation managers. These Dashboard InfoObjects are provided in both English and German depending on the application GUI language.
Valuemation uses primarily the USU Valuemation Analytics tool for consolidating, analyzing and presenting IT data. Valuemation Analytics data presentation is based on KPIs and customized dashboards facilitating easy analysis of data and detection of interrelationships, dependencies and weak points in the business operation. To learn more, please go to the Valuemation Analytics chapter.
Random examples of Dashboard InfoObjects implemented in Valuemation:
- 10 oldest tickets
- Total number of created tickets
- Total number of active tickets sorted by ticket type, superior category and category
- Total number of active tickets sorted by agent group and status
- Average time for solving tickets
- Possible items sorted by article class (quantity/price) [for Oracle databases only]
- Systems sorted by status, system type and location
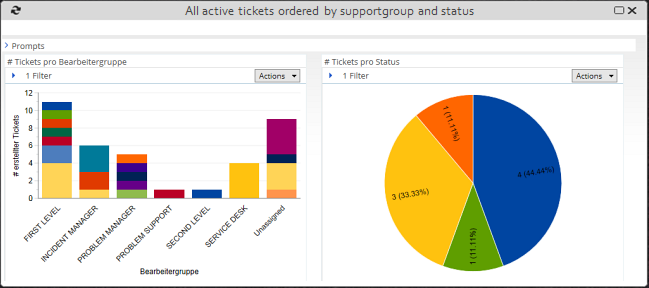
Example: Dashboard InfoObject for Incident/Problem/Change Management.