|
|
|
|
|
Costflow
The 'Costflow' functionality enables you to display the information on the costs for providing services and the profitability of services (and customers) in a special, interactive Costflow chart.
- Open a Plan from the 'Plans' catalog and switch to the 'Calculation Results' reference view. You can see the results of the calculation (per element, per period).
- Specific attributes of the 'Calculation Results' tab (or the 'Distributed Costs' tab - depending on Valuemation version) contain information on the costs for providing services and provides insight into the profitability of services and customers:
- Consumption: costs consumed
- Production: costs distributed towards another object
- Capacity: total distributed quantity
- Unit Cost: the unit cost of provided products or services
- Unit Price: enter the value with which you want to calculate
- Income: Unit Price * Capacity
- Profit: Income – Production (if this result is negative, the font color of the row is red)
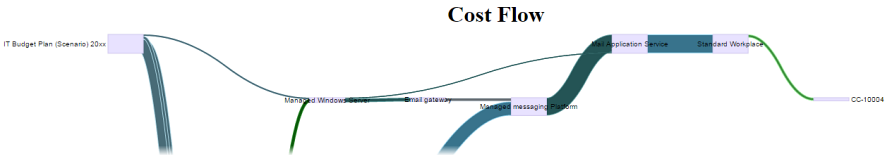
- Start the 'Costflow' action from the 'Print to PDF' menu.
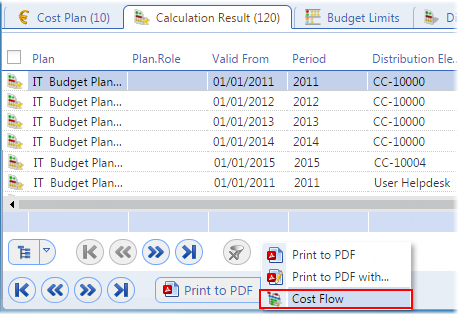
The Costflow chart will be generated from the 'Calculation Results' table (from all of the results).
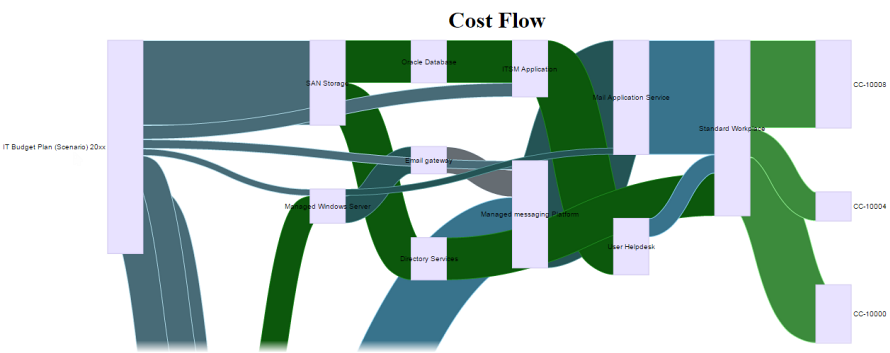
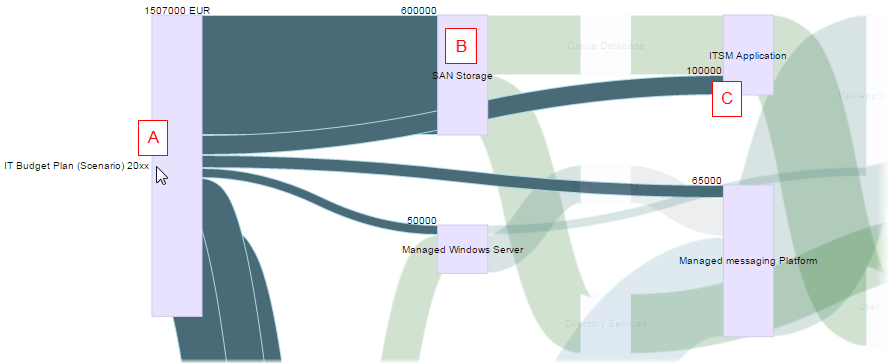
As you hover your mouse over the various distribution elements in the charts, you can interactively follow various parts of the cost flow.
For example, hover your mouse over the initial IT Budget Plan (1 507 000 EUR = the direct costs) (A) and move to the next (B) 'SAN Storage' distribution element. The whole path will be highlighted relative to the rest of the chart (see below).
The same applies if you proceed to the next distribution element (C) etc.
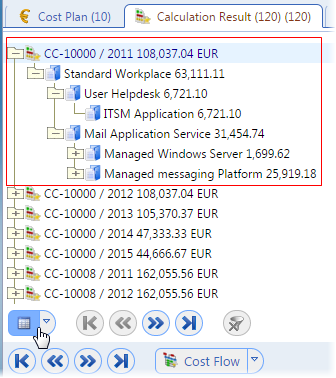
- The Costflow chart interpretation can be further supported by switching the 'Calculation Results' table into the tree view.
In this case, you can follow the cost flow in a tree.
- The Costflow chart can be displayed for just a single item, too.
Right-click an individual item in the 'Calculation Results' table and select the 'Cost flow' action.
Now the Costflow chart has been generated just for the selected item.