|
|
|
|
|
Compare expenses in different plans by period
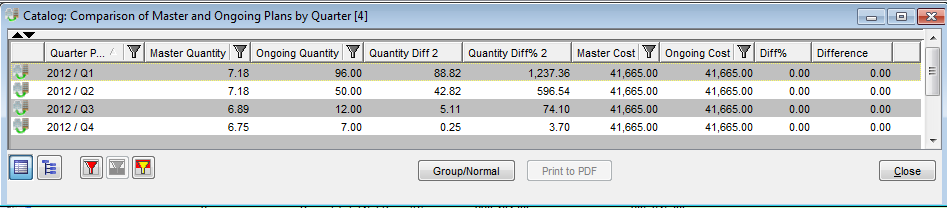
Comparing Total Costs per Period Planned in Different Plans
Open the catalog 'Comparison of Master and Ongoing Plans by Quarter'
We can obtain similar results using the Pivot Tablet in just a few simple steps:
- Open catalog 'Unified Payment'
- Group the catalog by Quarter in the first grouping level
- Group the catalog by Hi Plan in the second grouping level
- Specify the aggregation function Sum for the column 'TotalNetPrice(B)' and clear all other aggregation functions
- Specify catalog conditions to show only plans with roles Ongoing, Master and Actual
- Run the action Pivot Table.
- Press Skip to create a new Pivot table (existing Pivot tables are offered to the user in this step)
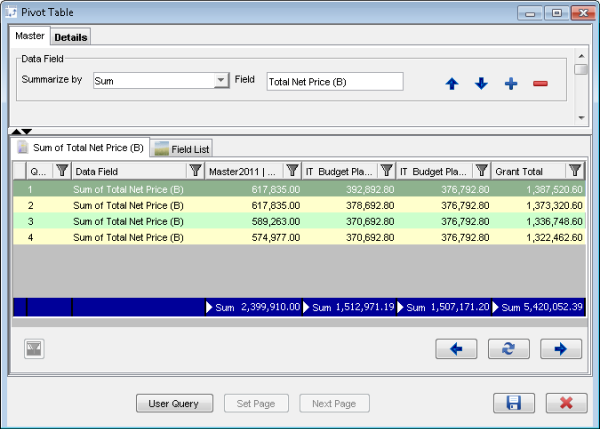
Only one data field is used - Total Net Price. To show more data fields:
- Switch to the reference catalog Field List
- Find the field "Required Quantity" and select the 'Data' area and 'Sum' to be summarized by
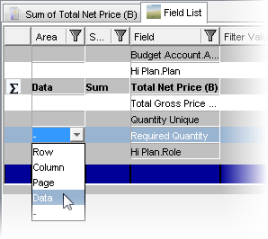
- Save
- Switch to the results reference catalog and hit the refresh button
We now have two data fields shown in our Pivot Table.
To see results in a different periods (Year, Quarter, Month):
- Switch to the Field List reference catalog again
- Select fields Year, Quarter and Month
- Press the 'Assign selected columns to the Row Area' button
- Save
- Switch to the results reference catalog and hit the 'Refresh' button
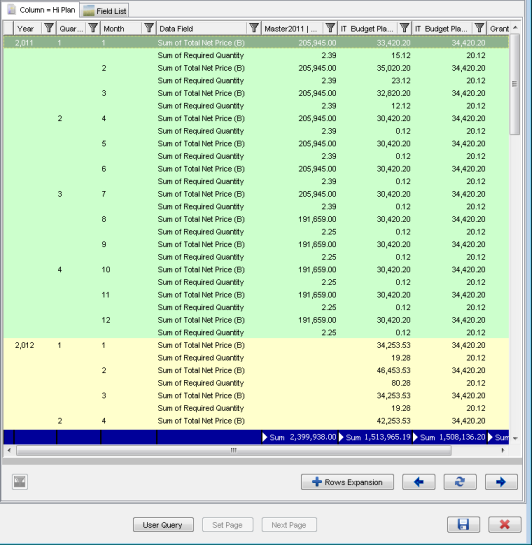
- By pressing the button 'Rows Expansion' followed by the 'Refresh' button the period granularity can be changed.
Similar functionality is available for column area. Product Class and Product Type can be assigned to the column area – buttons 'Up' and 'Down' can be used to specify the order of grouping. Use button 'Columns Expansion' to circle through available fields in the column area.
Another way to organize the report is by using the Page Area.
- Assign product class and product type to the page area, Hi Plan to the row area and Year to the column area:
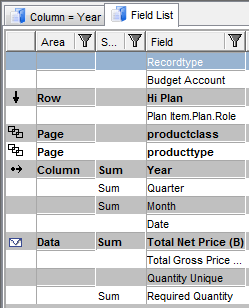
- Save
- Switch to the results reference catalog and hit the 'Refresh' button