|
|
|
|
|
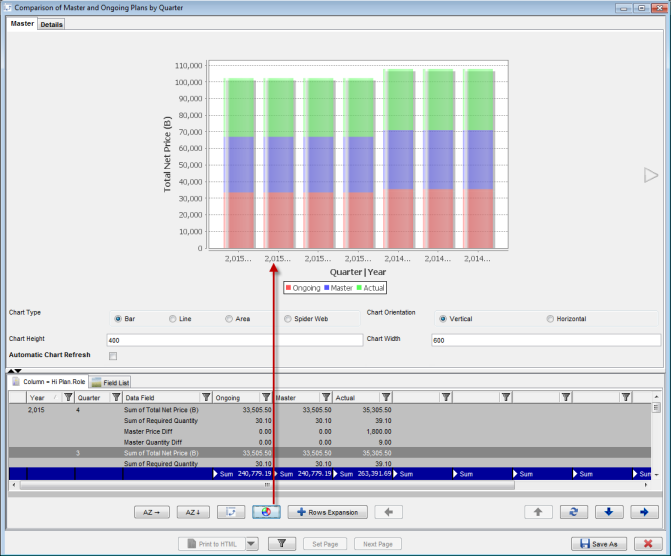
Pivot Table Charts
Valuemation offers the user the possibility to generate charts to the selected pivot tables. Once the button to generate/refresh the charts is pressed, the particular chart is shown in the Master tab.
Pivot Table ChartsValuemation offers the user the possibility to generate charts to the selected pivot tables. Once the button to generate/refresh the charts is pressed, the particular chart is shown in the Master tab.
| |||||