|
|
|
|
|
Analyze Resources Usage
One of important Resource Manager functions is the ability to get an overview of resource utilization within a specified period of time. For this, the special 'Resource View' is particularly well suited.
Opening the Resource View:
As multiple resources must be selected prior to opening the Resource View, it is accessible in the catalogs of resources. Namely:
- The 'Resources' reference catalog in the RM project editor
Select the resources whose use is to be analyzed and click the 'Resource View' button at the bottom of the 'Resources' tab.
- The 'Resources' catalog
The primary location of the 'Resources' catalog is the 'Resource Manager' sidebar (Work perspective). Open the catalog, select the resources whose use is to be analyzed and call the 'Resource View' context menu action.
The Resource View
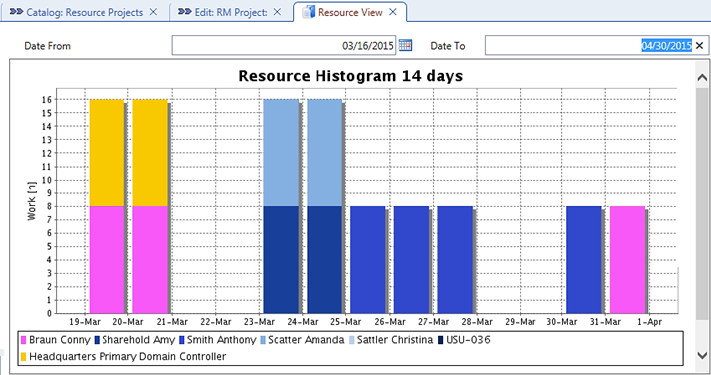
The Resource View displays a histogram of resource usage in a specified period of time. Additionally, the 'Usage' tab in the bottom part of the window provides a special calendar for a more detailed view of resource usage.
Resource Histogram In Use
- Open the Resource View for relevant resources (see 'Opening the Resource View' above)
- Use the 'Date From' and 'Date To' fields to specify the analyzed period, for example the time span of a project.
Click the refresh button at the bottom of the window to apply the change. The selected time span is indicated in the title of the histogram.
The analyzed period of time can also be changed using the '+' and '-' buttons at the bottom of the window.

- Individual resources are depicted by color-coding, with coding legend displayed under the histogram.
- Resource usage is represented by individual bars in the histogram. On bar is displayed for each day in which the resource was used, bar height represents the number of usage hours during the day.
The 'Usage' tab
The 'Usage' tab contains a calendar providing a detailed view of the resources usage.
The calendar grid on the right side of the tab is quantized in time intervals depending on the current zoom level, e.g. days, two days, etc. Each calendar cell displays the number of hours spent by individual resources on individual reservations in the given time intervals. When the zoom level changes, the numbers in the cells get recalculated to reflect the change in length of the displayed time intervals.
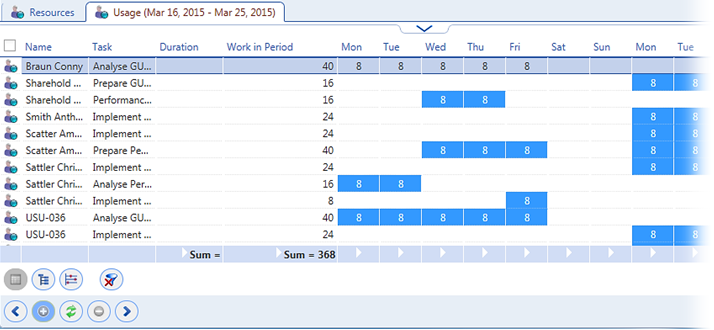
The Usage calendar in the normal (ungrouped) view
As each of the resource-reservation combinations is represented by one row in the calendar, grouping according to resources or reservations can be used to get a more concise overview of time allocation to resources or reservations, respectively.
'Usage' grouped according to resources
Group the calendar according to the 'Name' column in order to see time allocations to individual resources.
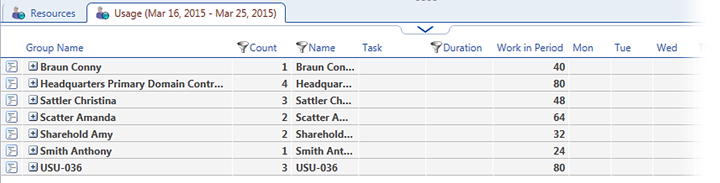
The Usage calendar grouped according to resources (i.e. the 'Name' column in the calendar)'
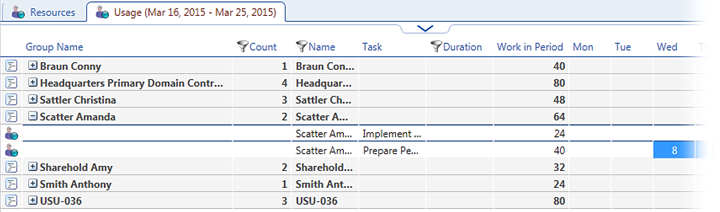
Click the 'plus' icon to expand the group and see on which reservations the resource worked in the observed period.
'Usage' grouped according to reservations
Group the calendar according to the 'Task' column in order to see time allocations to individual reservations.
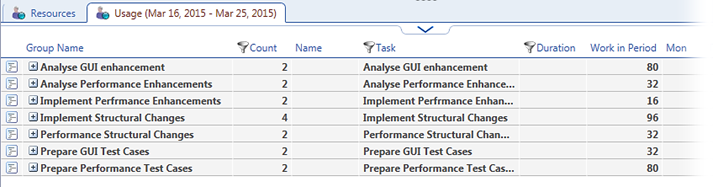
The Usage calendar grouped according to reservations (i.e. the 'Task' column in the calendar)'
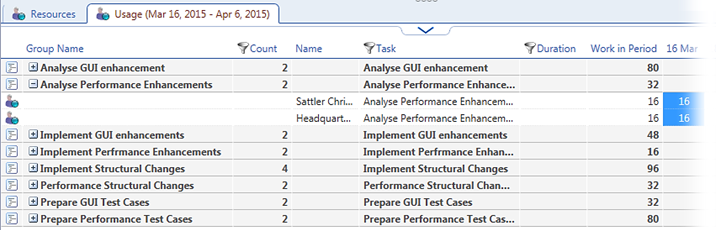
Click the 'plus' icon to expand the group and see which resources worked on the reservation in the observed period.