|
|
|
|
|
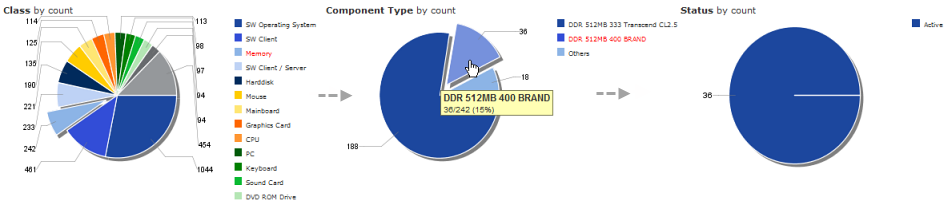
Operations in the Chart View
The pie chart itself brings a new, useful interactivity for this kind of view. When you click on a specific sector of the chart, another chart showing the second level of grouping appears on the right.
The result depends on the actual grouping set in the catalog. With another levels of grouping, you can proceed even further in the same way. Clicking back on the superordinate chart collapses the subordinate chart view.
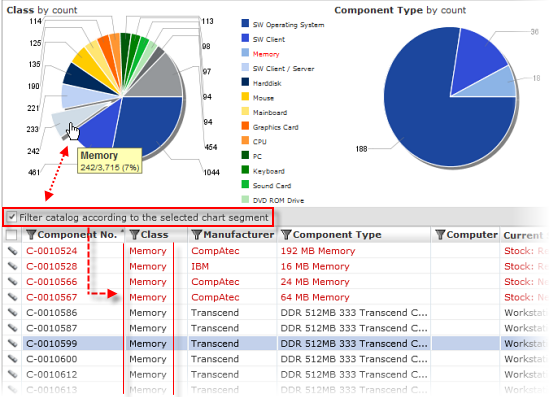
When the 'Filter catalog according to the selected chart segment' option is enabled, clicking on the particular sector of the pie chart immediately filters out the list of objects below in the catalog (the selection in the pie chart is used as a filter condition).
If the catalog is in the Group View mode, the selected region in the pie chart is expanded in the catalog table tree.
Note: Only the 'Others' chart sector cannot filter out anything because it contains all the other objects which do not fit to any specific region/group.
Once the catalog is closed (or the chart view is closed), the filter will be lost and all of the catalog data will be shown again.
If the 'Filter catalog according to the selected chart segment' check box is disabled, the catalog table shows all catalog data.