|
|
|
|
|
Updating Valuemation Analytics Dashboards
The dashboards are usually updated from time to time. In case Valuemation Analytics administrators send you some updated dashboards, usually the following two files are received:
- schema.xml
Mondrian schema of the data source (the name can vary).
- dashboards.zip
An archive with updated dashboards (the name can vary).
The configuration can be changed either in the guest system or in the host system. The following example supposes using the host system.
To perform the update, do the following:
Open the web browser on your local machine, type 'http://work_IP/console/Home' and log in to the Valuemation Analytics User Console.
Updating the 'schema.xml'
- Click 'Manage Data Sources' .
A dialog box with the same name opens.
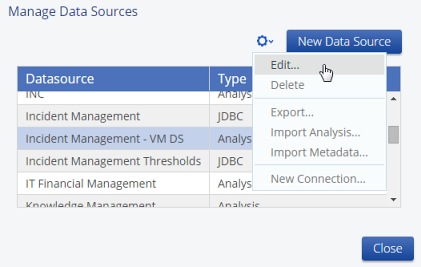
- Select the data source which you like to update.
In this example it is "Incident Management – VM DS".
- Click this icon
 and select 'Edit'.
The 'Import Analysis' dialog box appears.
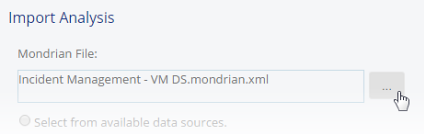
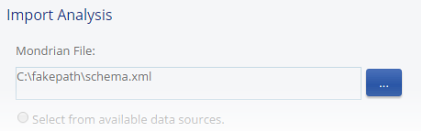
- Locate and select your "schema.xml" file.
Then the path is displayed in the dialog box.
- Click 'Save' and close the "Manage Data Sources" dialog box.
Updating the "dashboards.zip"
- Click 'Browse Files'.
The folder structure of Valuemation Analytics server appears.
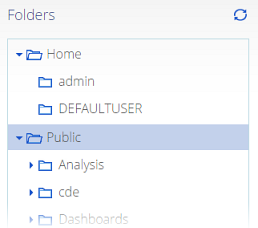
- Select the 'Public' folder and run the 'Upload' folder action.
A dialog box with the same name opens.
- Click 'Advanced Options' to check if the 'Replace the existing file' option is selected.
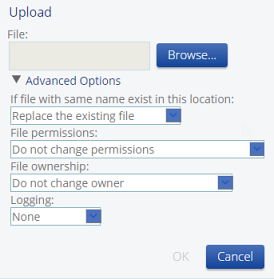
- Browse for your 'dashboards.zip' archive file and click 'OK'.
Wait until the following dialog disappears:

- Logout.
On the 'File' menu, select 'Log Out'.