|
|
|
|
|
Visualizer View in Detail
The following visualization - the Visualizer View - was started from the 'Persons (all)' catalog. Two persons ('Mrs.Sarah Anderson' and 'Mr.Bernd Bach') were selected in the catalog and the Visualizer was called.
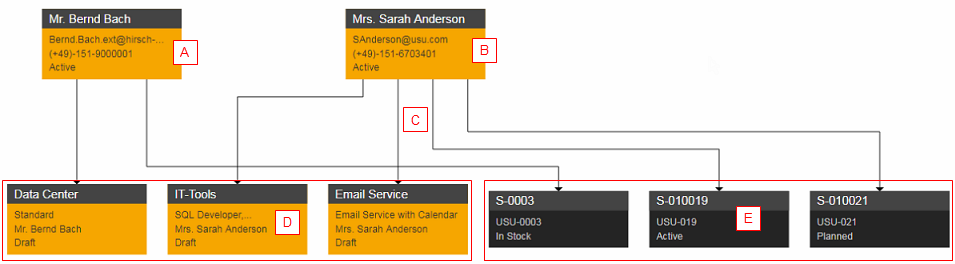
The Visualizer View shows the following:
- The selected persons (A) (B) have become the root nodes of the visualization.
- The edges (C) lead us to the related child nodes (D) (E) of the root nodes.
- Following the edges, we can clearly identify which persons have been assigned which services (D) and which systems (E).
Role of Visualization Profiles
It is important to note that the present visualization corresponds to a particular Visualization profile defined for the 'Person' object type.
Each profile defines the individual visualization content: For instance, you can create a definition to render a large number of relations and another profile can be limited to display just the selected relations as the child nodes and their specific attributes.
Note: When there are more profiles defined for an object type, you can toggle between the profiles using the Profile selector in the toolbar.
|
Profiles Comparison
Compare the differences between two different profiles defined for the same (Person) object type.
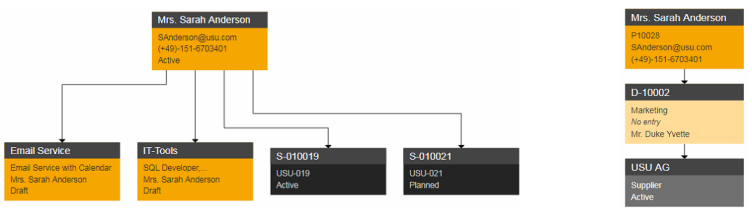
While the first profile is defined to show the person's relations to services and target systems, the second profile definition is limited to show the root node just with its relation to the department and its supplier. The Valuemation administrator is free to define an unlimited number of such profiles with various parent-child relations and displayed attributes.