|
|
|
|
|
The Timeline View
The Timeline view uses Gantt charts to display time-dependent data. A Gantt chart is a type of bar chart showing activities (tasks, events) displayed against time. Each activity is represented by a bar; the position and length of the bar reflect the start date, duration and end date of the activity. Gantt charts are primarily used for scheduling of resources, scheduling of production processes or employee rostering.
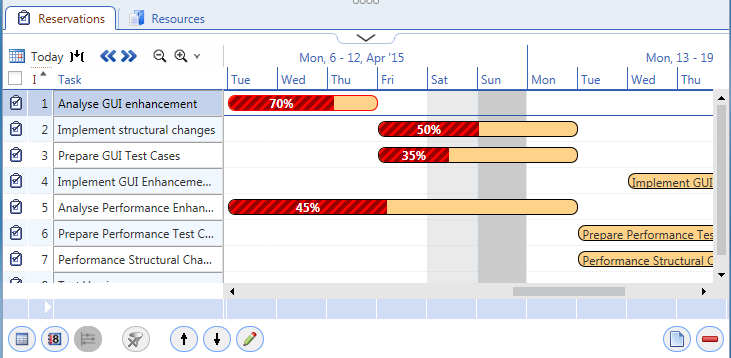
The Timeline view in Valuemation Resource Manager
Opening the Timeline View
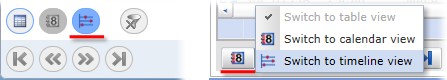
To switch a catalog to the Timeline view, use either a drop down box or separate buttons in the bottom left-hand corner of the catalog.