Escalation Log
The Escalation Process records various pieces of information in the Valuemation Log. The Log Level can be used to specify the amount of detail which will be written to the log. The Valuemation Log can be viewed using the Log Viewer available in the Administrator menu. The Log Level can be specified in the Escalation Parameter object. The log level range is 0 - 7 (please see also the Customizer Settings in the User Settings).
Use the Log Viewer to view the escalation log entries. Use the Connection Type "Local File" to access the log file on the same computer. The name of the log file is contained in File (in this case d:\valuemation\valuemation.log).
Use the Filter Options to select specific Log Entries:
Maximum Log Level |
Which level of Log entries will be displayed (in this case ALL). |
Select Module |
The Log Entries from different modules. To read the Escalation Log entries enter ESC here. |
From Date |
The start date for log entries |
To Date |
The end date for log entries. This is useful if you need to analyze log entries from a previous point in time (which has not yet been deleted). |
|
|
Click on the Apply button to apply the filter options to the Log File and view the results in the window.
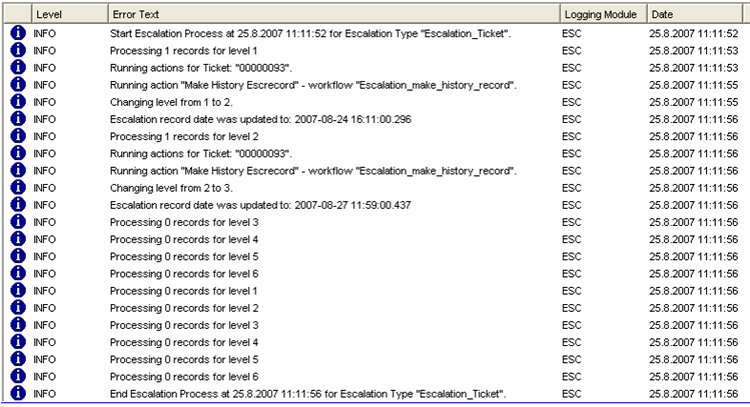
In this case we can see that the start time of the escalation is recorded. This is followed by a list of the number of entries which were found for a given Escalation Level ("Processing 0 records for level 3" or “Bearbeitung von x Sätzen für die Stufe y”)
In this case there was only escalation for one Incident (00...093) at Levels 1 and 2.

The Log Viewer after an Escalation Run
As the most detailed Escalation Log Level has been specified, the Log contains a list of all the actions carried out for each Incident which is escalated.