|
|
|
|
|
Status Page
Valuemation Web provides the 'VM Status Info' servlet which displays essential information about the internal status of Valuemation Web running on this server. No special authentication is required for this page to be displayed.
By default, the formatted HTML table is available. The unformatted JSON response can be also configured so that you can embed it in the existing applications.
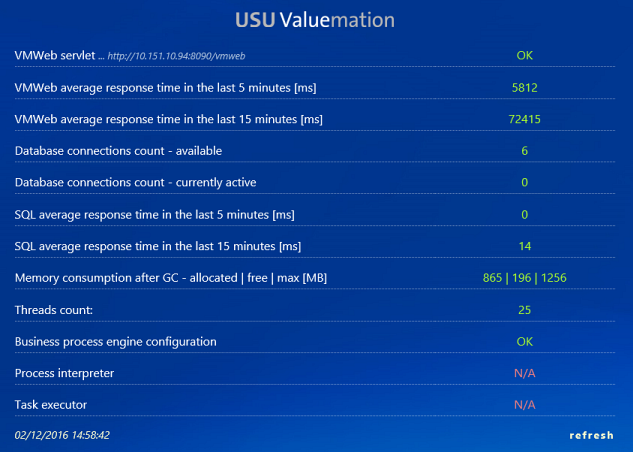
The Status Page can display the following data:
- VMWeb Servlet
Shows if the 'vmweb' is running.
- VMWeb average response time in the last 5 mins (ms)
Shows the average response times (in ms) of requests on this server in the last 5 minutes.
- VMWeb average response time in the last 15 mins (ms)
Shows the average response times (in ms) of requests on this server in the last 15 minutes.
- Database connections count - available
Displays how many database connections are available at the moment.
- Database connection count - currently active
Displays how many database connections are being used concurrently.
- SQL average response time in the last 5 mins (ms)
Shows the average SQL execution times (ms) on this server in the last 5 minutes.
- SQL average response time in the last 15 mins (ms)
Shows the average SQL execution times (ms) on this server in the last 15 minutes.
- Memory consumption - allocated / free (*) / max. (MB)
The 3 values have the following meaning:
- allocated memory = latest allocated memory of the JVM (minimum heap size <= allocated memory <= maximum heap size)
- free (*) = the amount of free available memory (MB). This value does not take into account objects which are possibly no longer allocated and could be freed with the next minor or major Garbage Collection Cycle.
- max = the maximum Heap size to which the JVM can grow (allocate memory)
- Threads count
Displays the number of threads running in the servlet.
- Business Process Engine configuration
Shows whether the Process Engine is defined or not (--). If defined, it shows whether it is running or not (OK/NOK).
- Process interpreter
Shows if the Process Interpreter is running on this server server.
- Task executor
Shows if a Task Executor is running on this server server.