|
|
|
|
|
Debug Navigation
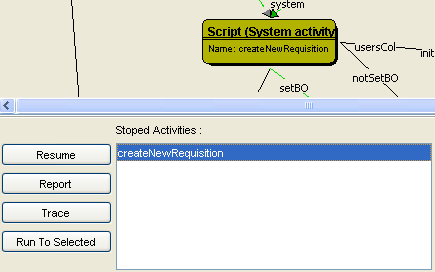
The following buttons are available for navigation through the above described debugging process:
Button |
Function / Meaning |
Resume |
Runs the activity which is currently selected in the Stopped Activities list. |
Report |
Displays as report on the current activity status |
Trace |
Enabled only for activities of the 'Script' type. It enables editing of the Python script contained in the currently stopped node. |
Run To Selected |
Runs the workflow from the currently stopped activity to the activity selected in the upper part of the window. |
|
|
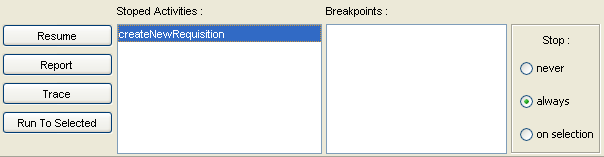
'Resume' versus 'Run to Selected'
The default behaviour of the 'Resume' command is to execute the activity which is currently selected in the 'Stopped Activities' list, that is to 'run the workflow only one activity forward'. This default behaviour can be changed by the 'never/always/on selection' radio buttons. These specify where the workflow stops when the resume command is used.
Stop: |
Meaning |
never |
The workflow 'never' stops, this means that the workflow will be executed to the end (all necessary activities will be executed without interruptions). Note, however, that the 'never' setting applies only to activities which have not been stopped already, the already stopped activities must be run manually (using the above described 'Resume' button) before the rest of the workflow can be executed automatically. |
always |
Default setting. The workflow always stops, i.e. each activity must be triggered by pressing the 'Resume' button. |
on selection |
The workflow stops at the nearest node breakpoint, see below. |
|
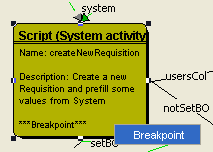
In order to create a node breakpoint, right-click the node at which you want the workflow to stop (during debugging) and select 'Breakpoint' from the right-click menu. This turns the node into a node breakpoint which means that if the 'on selection' option is selected, the workflow debug execution will stop at this node. The fact that a node is a node breakpoint is signified by a '***Breakpoint***' remark below node description. Note that you may have to enlarge the node to actually see the remark.
|
Note: We distinguish between two kinds of debugging breakpoints:
- Node Breakpoints - described in this topic
- Script Breakpoints - described in the text devoted to script debugging
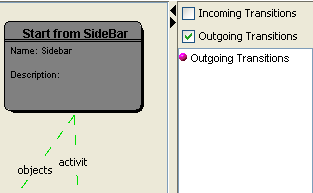
Incoming versus Outgoing Transitions
Using the 'Incoming Transitions' and 'Outgoing Transitions' check boxes it is possible to determine what gets displayed for the transitions of a selected node:
- Oncoming data and their values
- Outgoing data and their values
Both incoming and outgoing data can be displayed at the same time.