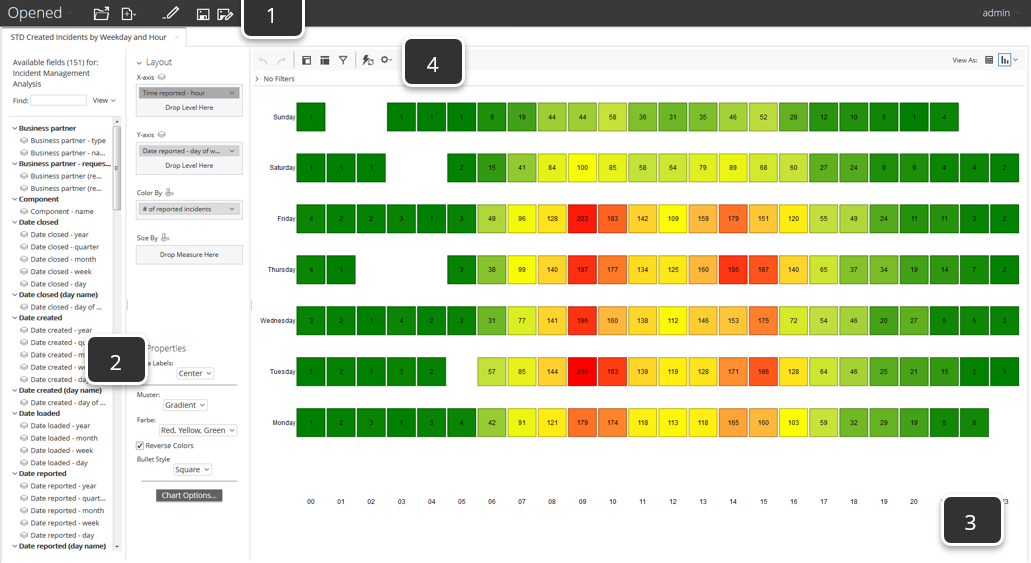
Tour the Analyzer Panels
To create a new Analyzer Report, follow these steps:
From User Console Home, click Create New, then Analysis Report.
Choose a data source for the report from the Select Data Source dialog box. Click Ok.
The new Analyzer report appears in the Opened page. Click the Add More Fields and Rearrange Fields
 icons on the toolbar to expand the Available Fields and Layout panels if they are hidden.
 |
Name | Function | |
|---|---|---|
1. | Opened view | Displays quick access buttons across the top to create and save new Analysis reports and Dashboards. Opened reports and files show as a series of tabs across the page. |
2. | Available Fields and Layout panels | Use the Available Fields and Layout panels to drag levels and measures into a report. Your report displays changes in the Report Canvas as you drag items onto the Layout panel. Delete a level or measure from your report by dragging it from the Layout panel to the trashcan that appears in the lower right corner of the Report Canvas. |
3. | Report Canvas | Shows a dynamic view of your report as you work to build it. The look of your report changes constantly as you work with Available Fields and Layout panels to refine it. The Report Canvas shows different fields based on the chart type selected. |
4. | Analyzer Toolbar and Filters | Use the Analyzer Toolbar functions to undo or redo actions, hide lists of fields, add or hide filters, disable the auto-refresh function, adjust settings, and change the view of your report. Use the Filters panel to display a list of filters applied to the active report or edit or delete filters. |