Use Content Linking to Create Interactive Dashboards
Depending on your needs, you can create a "static" dashboard, which contains content in each panel that is separate but related. For example, you may provide users with a bar chart that contains total sales figures by region. Additionally, you may provide a data table that displays sales details for each state in a specific region. You may also want to provide sales data associated with each salesperson in a specific region. The content in your dashboard is useful to dashboard consumers, but to make it more "interactive," you may want to consider using content linking.
The content linking features in dashboards allow you to associate (link) content in one dashboard panel to content on another dashboard panel if query parameters have been defined. These features are particularly helpful for drilling down or for dynamic filtering; for example, when dashboard consumers explode a single slice in a pie chart to launch content in a data table associated with that pie slice. In this instance, dashboard consumers are moving from a summary view to a detailed view interactively.
You can use content linking if your dashboard panel contains an Analyzer report or Report Designer based report (.prpt).
Content Linking and Query Parameters
Query parameters are required for content inside a dashboard panel to receive values used to filter data from a filter control. They are also required when receiving values from content in other dashboard panels that are broadcasting values associated with Content Linking. The way in which query parameters are defined is different depending on the type of content you are placing inside your dashboard panels.
Link an Analyzer Chart to a Report
You can create content-to-content links between an Analyzer chart and any other parameterized report such as a Report Designer report or another Analyzer report.
Below are general instructions for linking an Analyzer chart to a report. You must adjust the instructions when working with your own data.
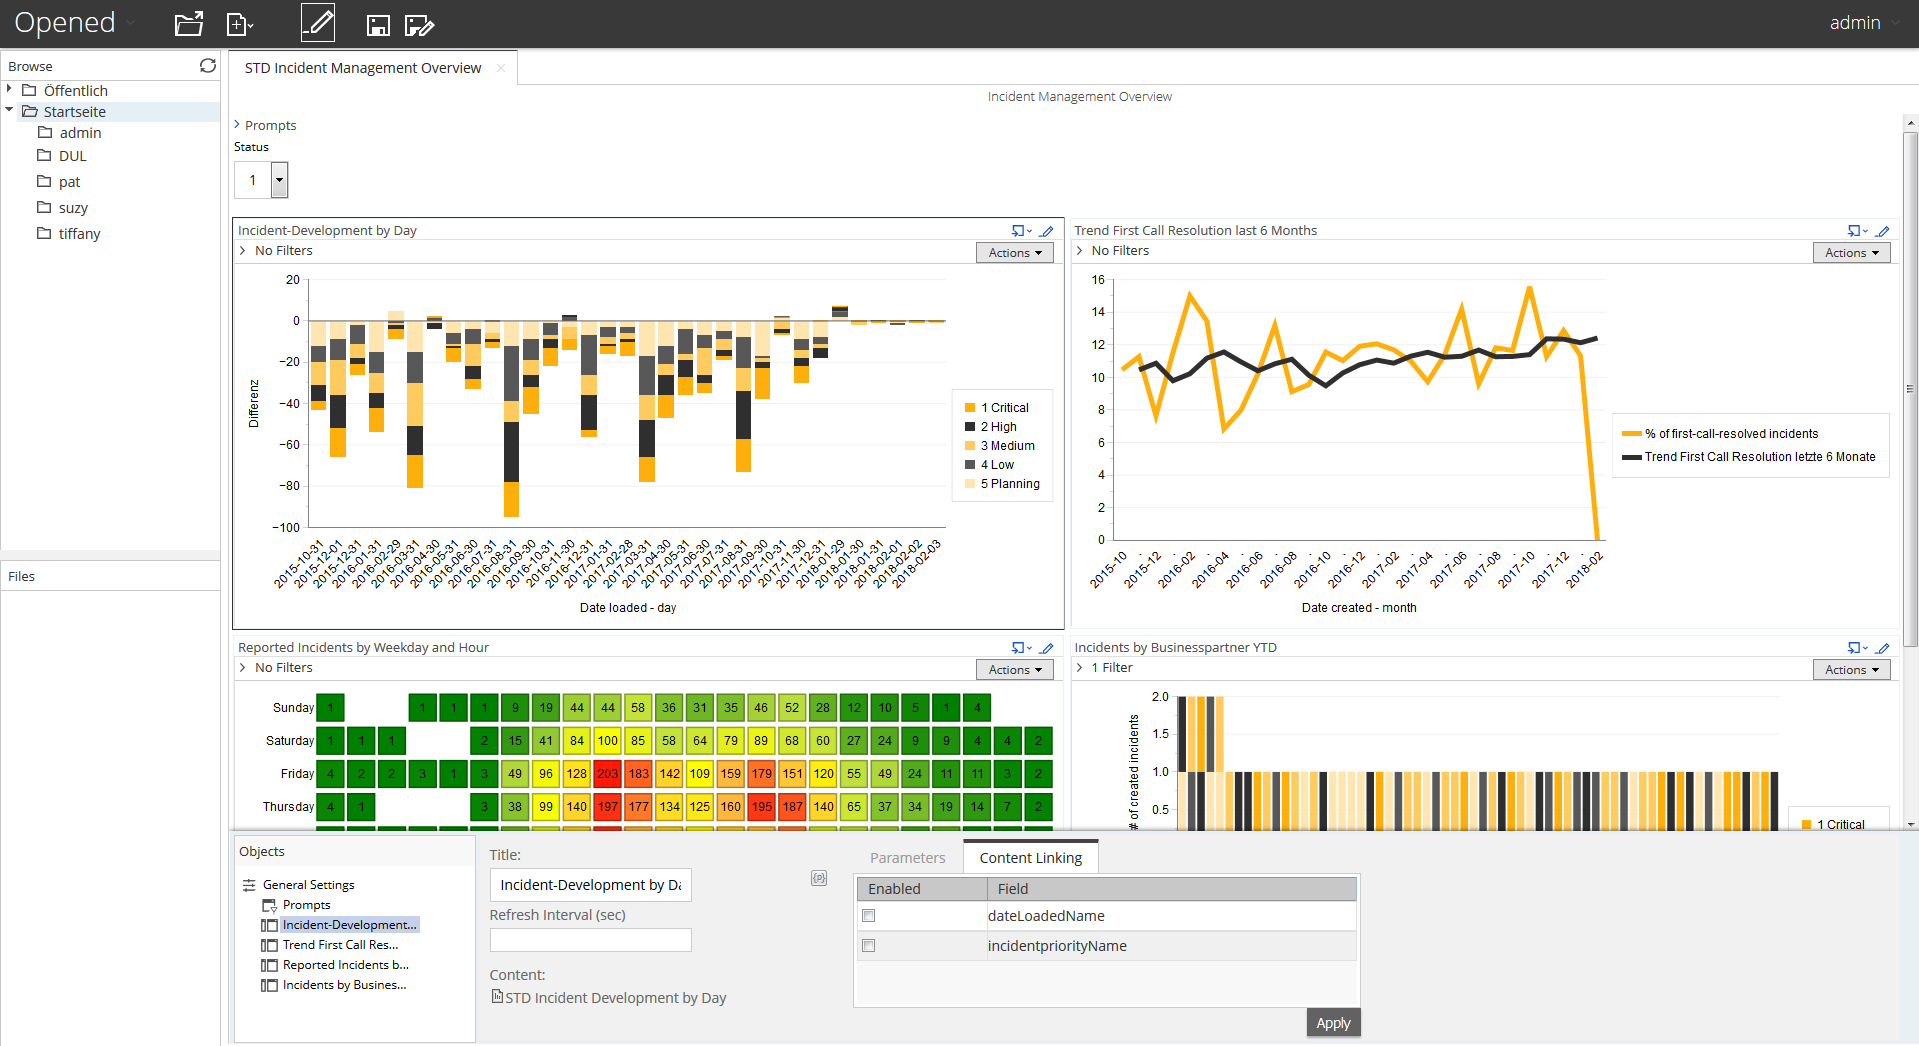
Create a simple dashboard that contains an Analyzer chart and a parameterized report. The example above displays an Analyzer chart and an Analyzer Report displayed as a table view. At this point, none of the content has been linked and you have a "static" dashboard. Hypothetically, if you want users to be able to click a bar in the bar chart and update the Analyzer table view, the table must contain at least one parameter.

Under General Settings, choose the Analyzer chart. Click the Content Linking tab then click the check box (or check boxes) next to the field/column name you want enabled for content linking. Click Apply.
Under General Settings, choose the Analyzer Report (table view) and click the Parameters tab. Click the down arrow, in the Source text box to display another source for the parameters you created.
Save your dashboard.