Geography Map Visualizations in Analyzer
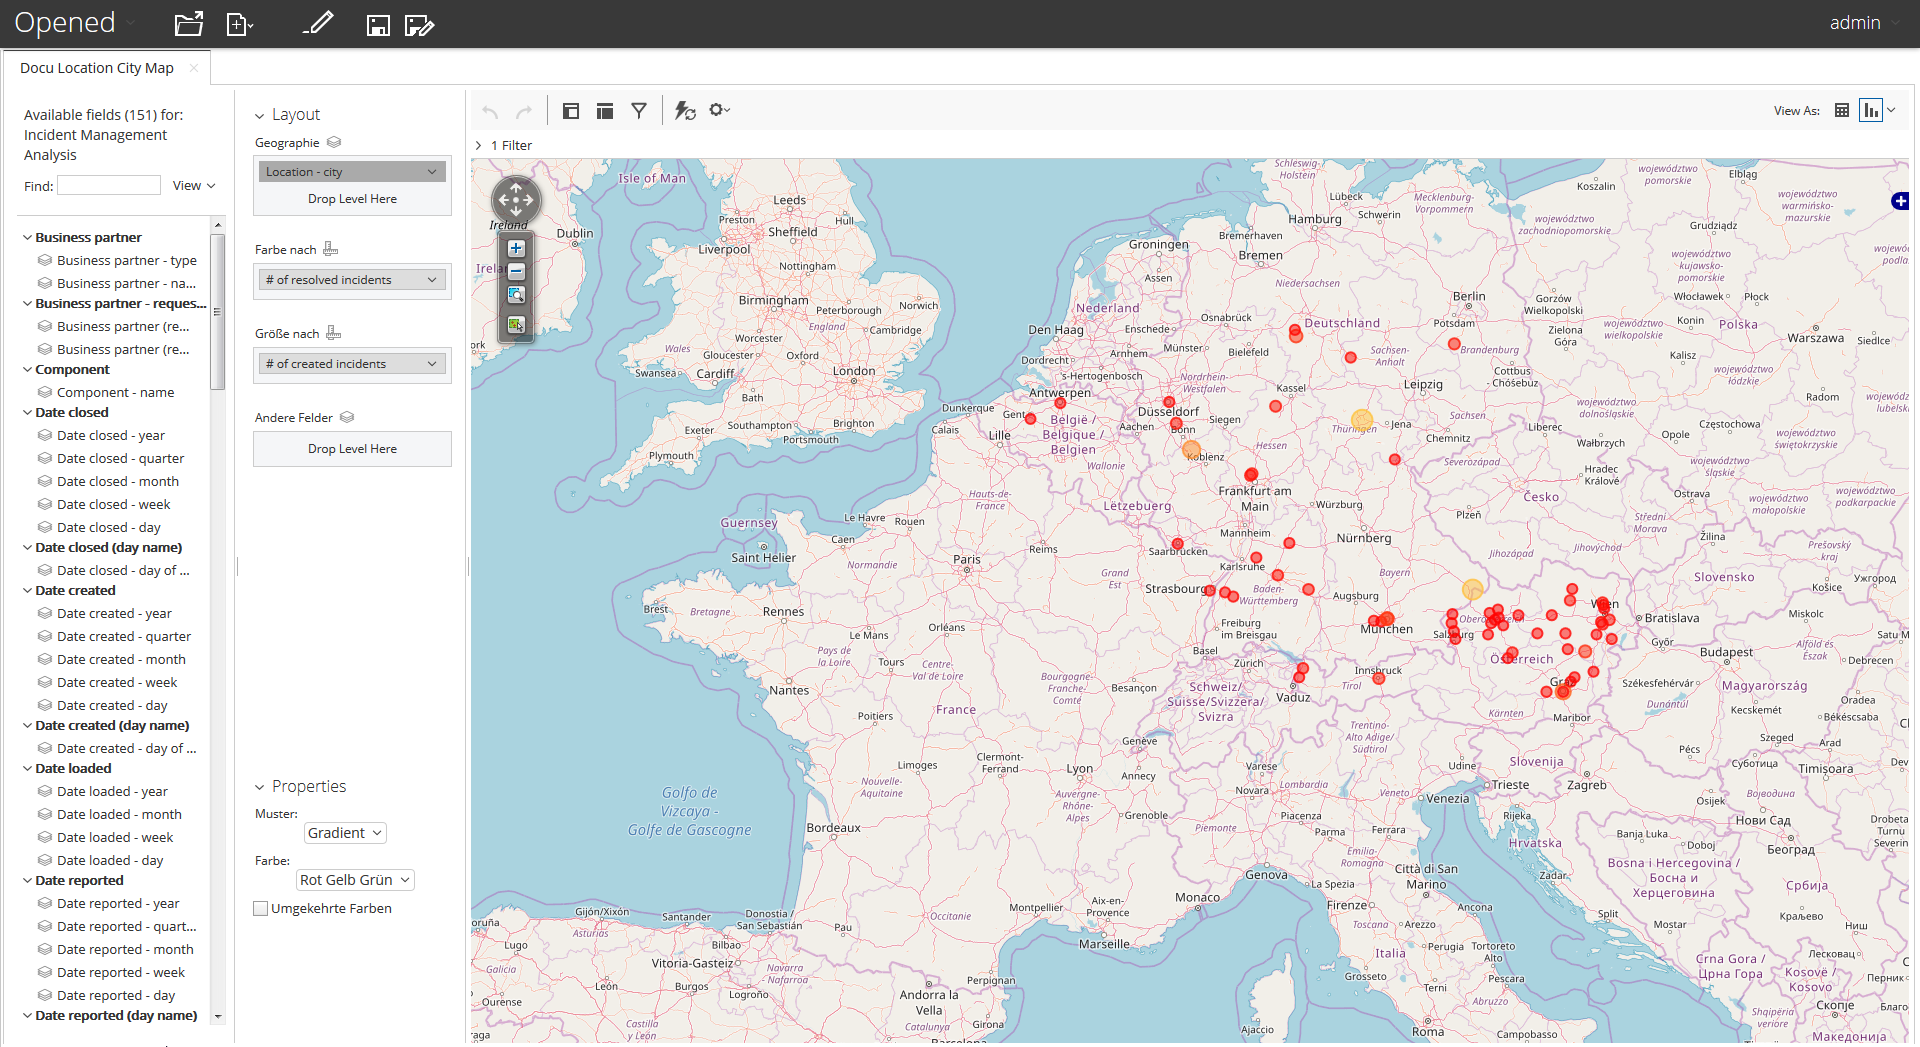
Geo maps enable you to visualize data on a geographic map. This visualization type will plot a pin on a map based on the location attribute used. You can then use a measure to color-code the pen and/or use a measure to specify the size of the pin. If your model has geographic annotations, then the location information will be retrieved by the geoservice automatically.
A license from Google might be required if Google Maps are used.