Scatter Chart Visualizations in Analyzer
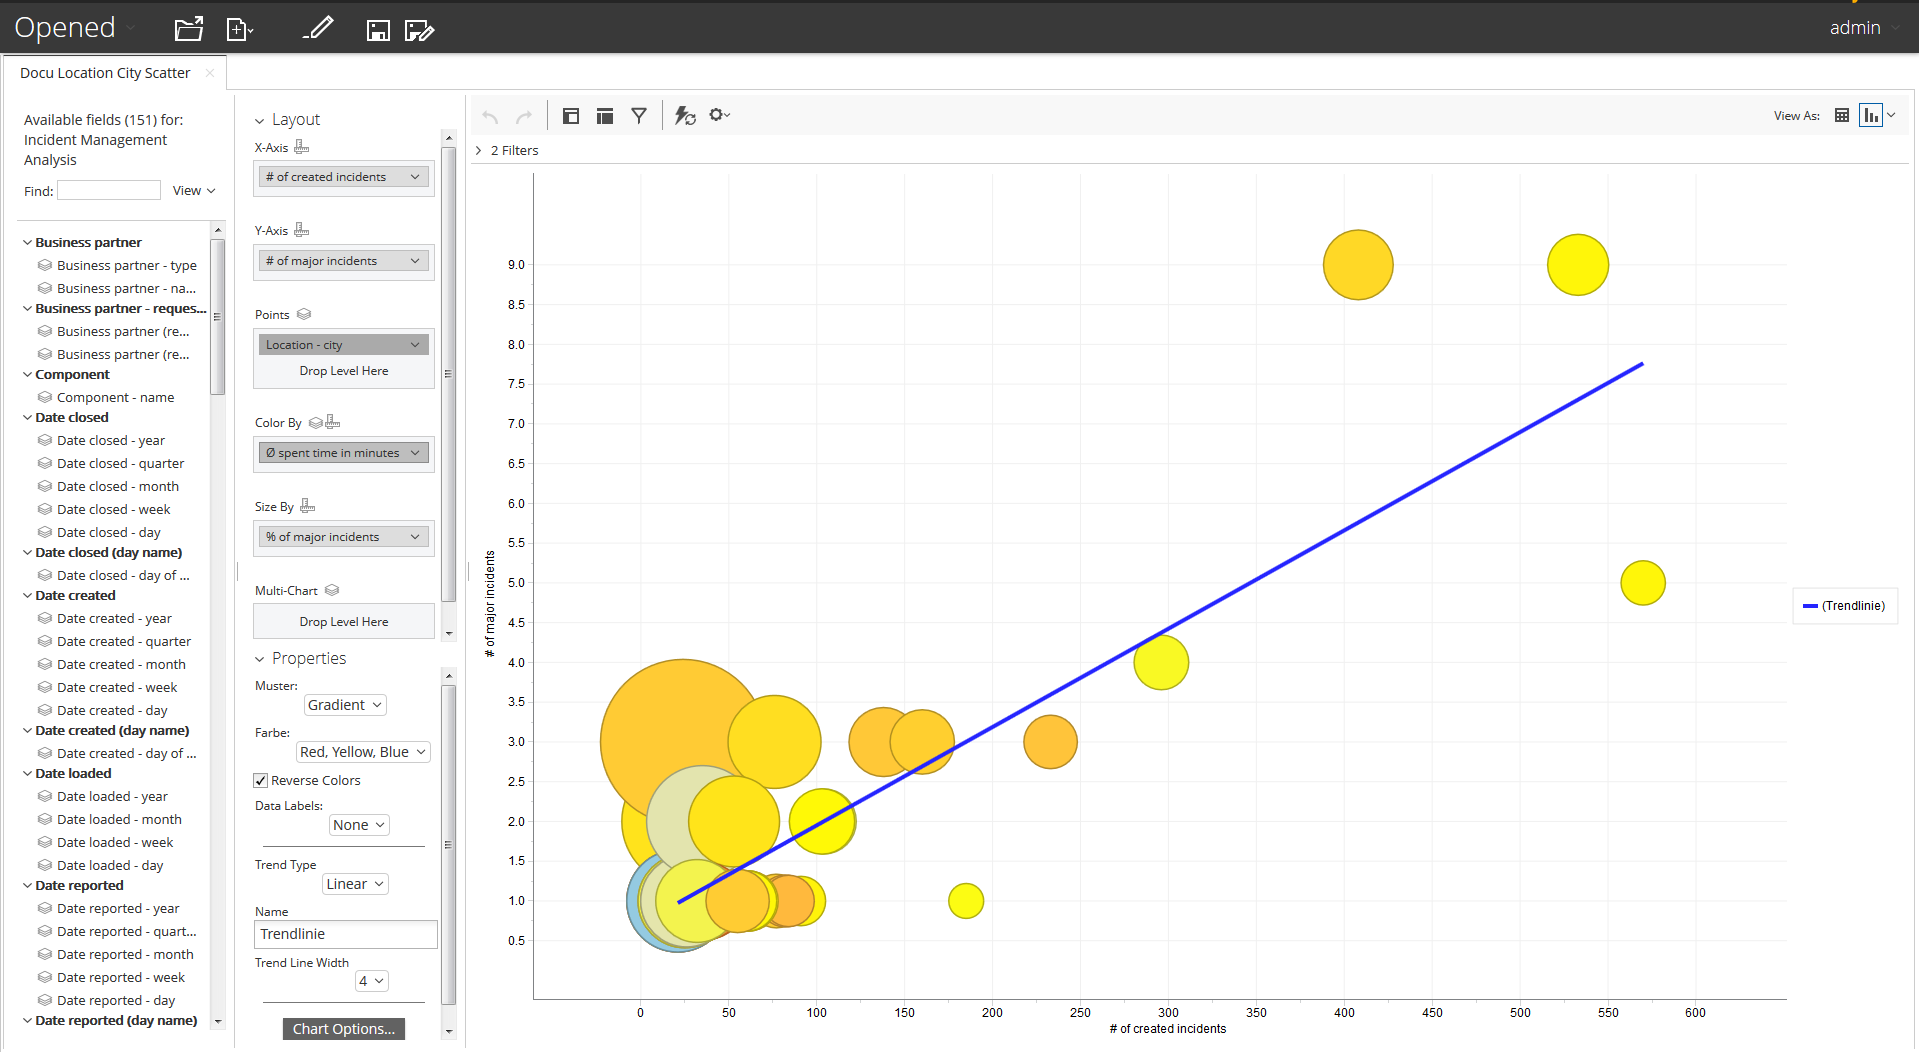
Scatter charts allow users the ability to visualize data on a graph. This visualization type will plot a bubble on a graph based on the attributes used. You can then use a measure to color-code the bubble and/or use a measure to specify the size of the bubble.